Learn how to navigate and utilize the SLYD dashboard to monitor resources, track costs, and manage your cloud infrastructure.
The SLYD dashboard is your command center for managing compute resources, monitoring performance, tracking costs, and accessing all platform features. With real-time metrics, intuitive visualizations, and quick actions, the dashboard provides everything you need to effectively manage your cloud infrastructure.
Active instance tracking & usage trends
Live spending monitoring
One-click GPU/CPU launching
Complete activity feed & support
Get deep insights into your compute usage and performance with comprehensive tracking and trend analysis:
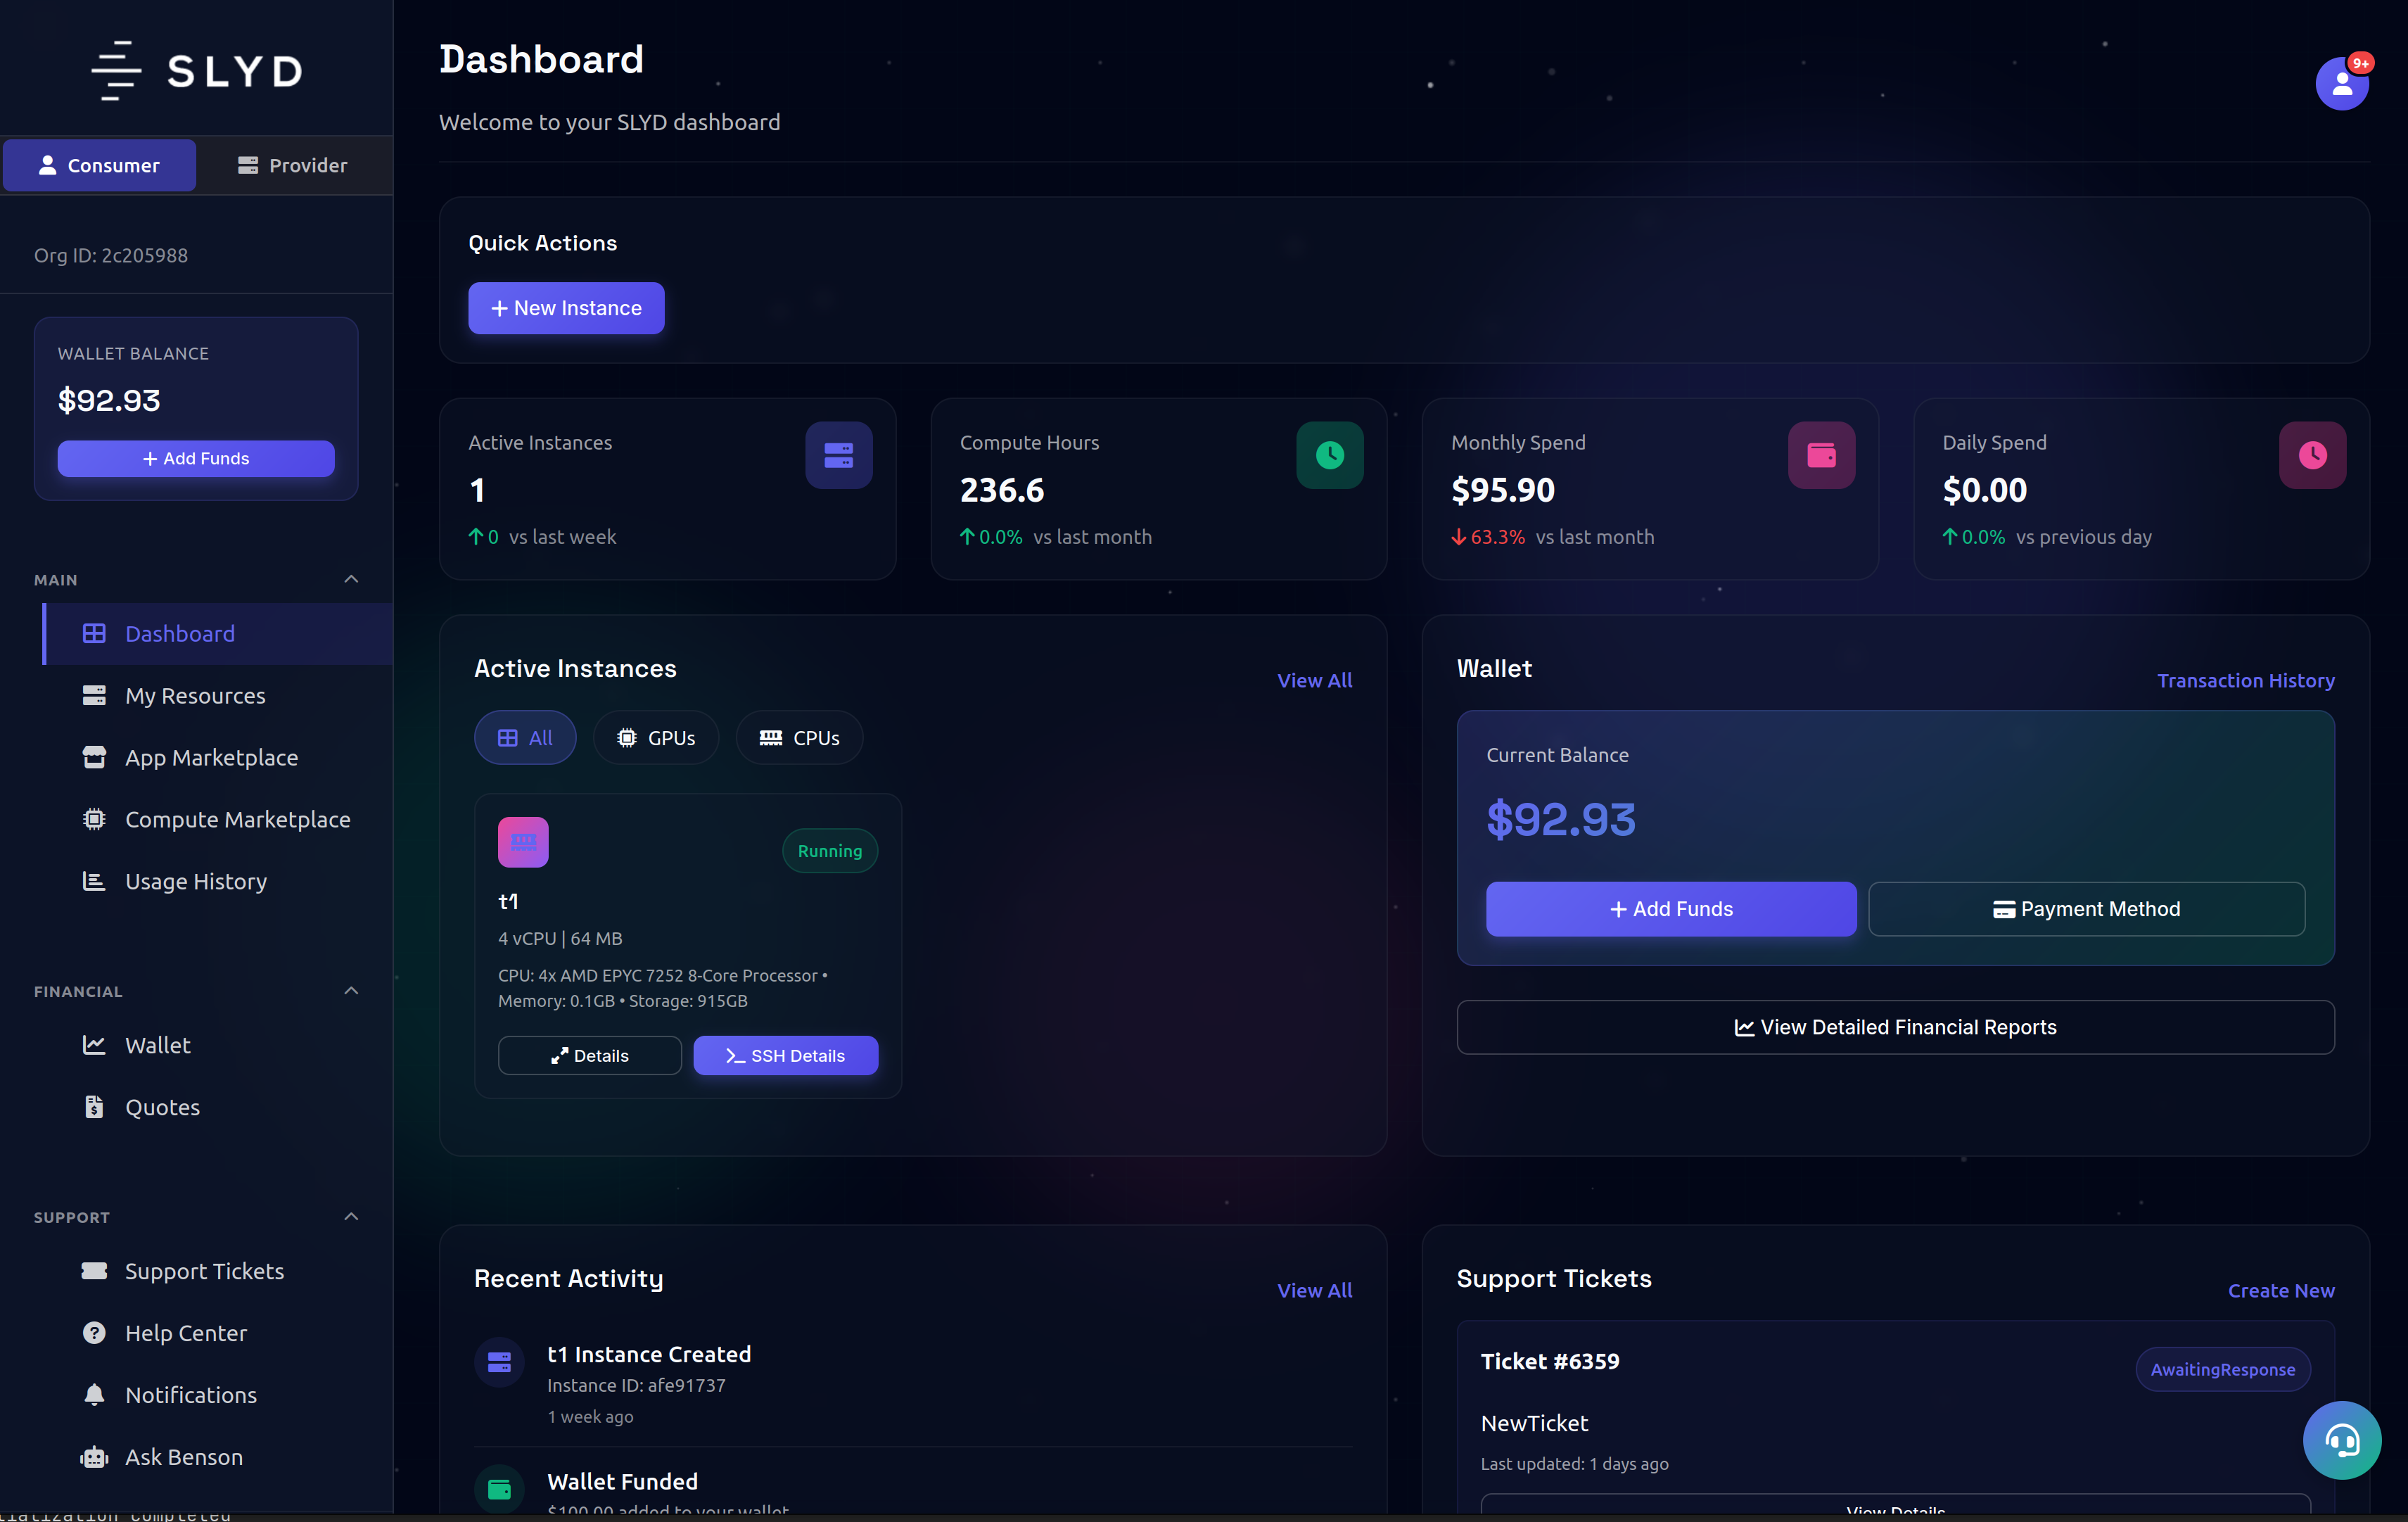
Fig 1. SLYD Analytics Dashboard with active instance tracking, compute hours monitoring, and performance metrics
Monitor all active instances in real-time with detailed usage trend analysis. Track resource utilization patterns, identify peak usage periods, and optimize your compute allocation based on historical data and predictive insights.
Track compute hours consumed across all instances with comprehensive historical comparisons. Analyze usage patterns over time, compare monthly and weekly trends, and forecast future compute needs based on historical consumption data.
View comprehensive performance metrics including CPU utilization, memory usage, network I/O, and storage statistics. Real-time charts and graphs provide immediate insights into resource efficiency and system health across your entire infrastructure.
The analytics dashboard provides comprehensive insights into your compute usage patterns with advanced trend analysis, predictive modeling, and performance optimization recommendations. Make data-driven decisions about resource allocation and scaling with detailed historical comparisons and forecasting capabilities.
Stay in complete control of your spending with transparent cost tracking and integrated wallet management:
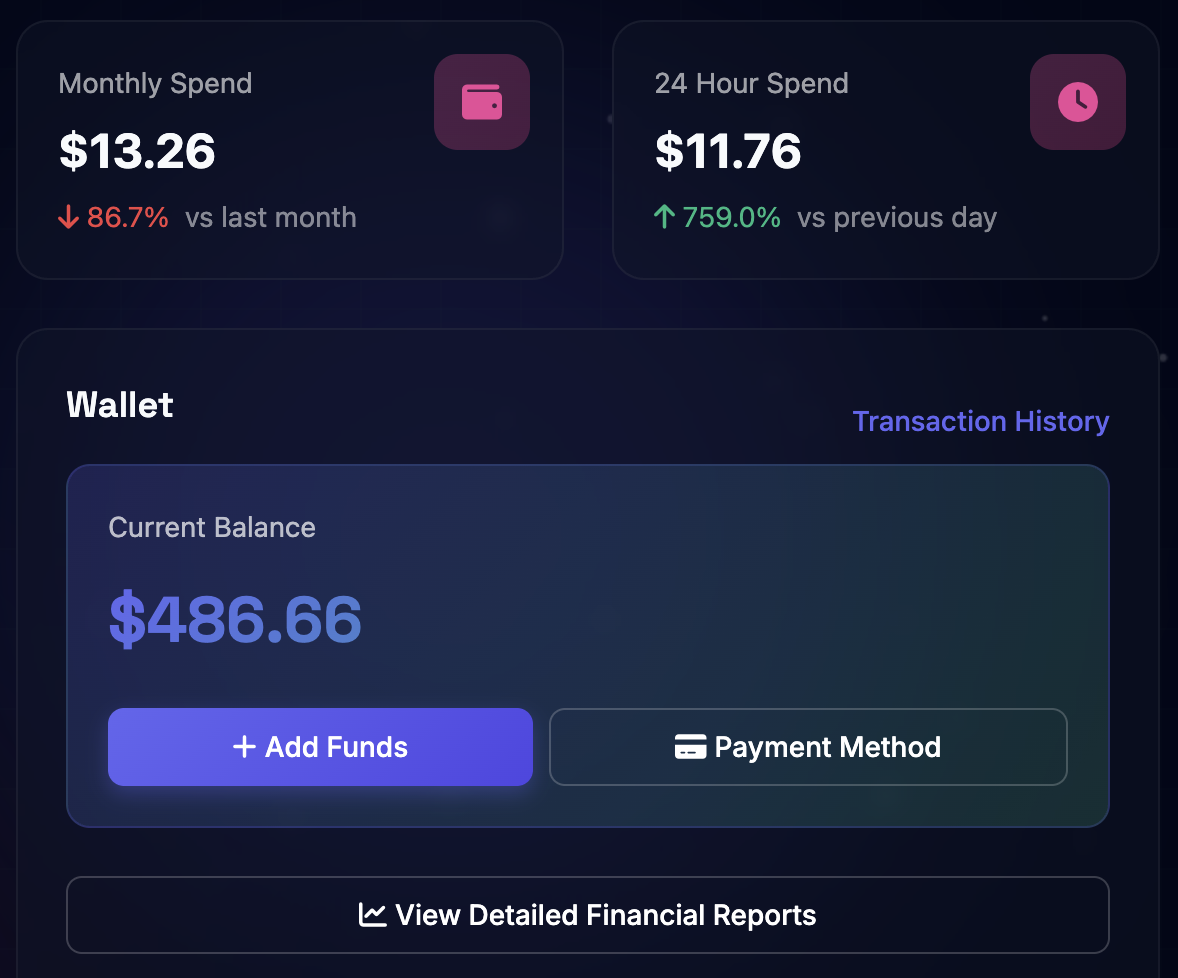
Fig 2. Real-time cost management with 24-hour and monthly spending views, integrated wallet system, and transparent cost tracking
Track your costs in real-time with comprehensive 24-hour and monthly spending views. See exactly how much you're spending as resources are consumed with up-to-the-minute cost tracking, detailed breakdowns by resource type, and spending velocity indicators.
View your current wallet balance and spending rate directly on the dashboard. The integrated wallet system displays real-time balance updates, spending velocity, transaction history, and automated recharge options to ensure uninterrupted service.
Every resource displays its hourly cost and accumulated charges with detailed breakdowns by service type. Complete cost transparency with no hidden fees, surprise charges, or unclear billing - see exactly what you're paying for with comprehensive cost visibility and predictive spending alerts.
SLYD's cost management system provides complete financial transparency with real-time spending monitoring, integrated wallet balance tracking, and predictive billing alerts. Set up automated recharge thresholds, monitor spending trends, and maintain complete budget control with detailed transaction history and cost forecasting.
Deploy high-performance compute instances instantly with professional hardware and real-time monitoring:
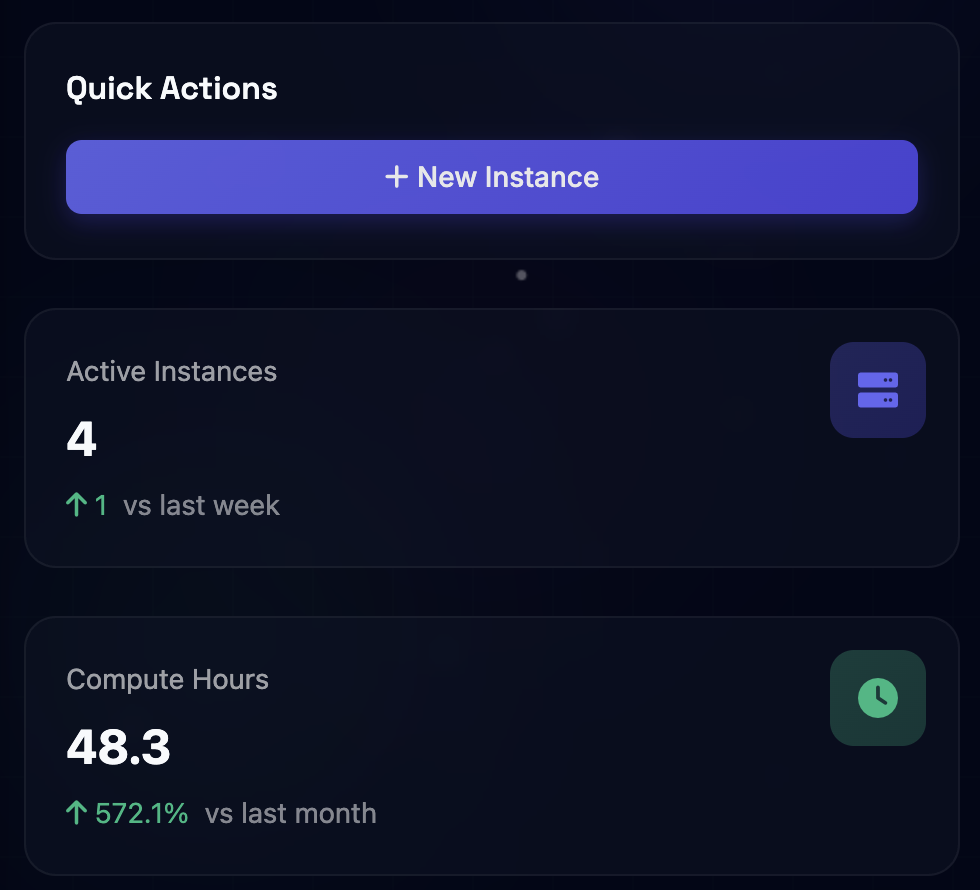
Fig 3. One-click instance deployment with professional hardware options, real-time monitoring, and instant SSH access
Launch enterprise-grade GPU and CPU instances with one click. Access high-performance computing resources instantly, with deployment times under 60 seconds and immediate availability for any workload size or complexity requirement.
Deploy instances powered by Intel Xeon processors with up to 64 cores and NVIDIA RTX A6000 graphics cards with up to 48GB VRAM. Enterprise-grade hardware typically found in professional data centers, available on-demand with guaranteed performance and reliability.
Monitor instance health, performance metrics, and resource utilization with live updating dashboards. Get immediate SSH access with one-click connection commands, secure terminal access, and real-time performance monitoring directly from the deployment interface.
Complete transparency and professional support with comprehensive activity tracking and integrated help systems:
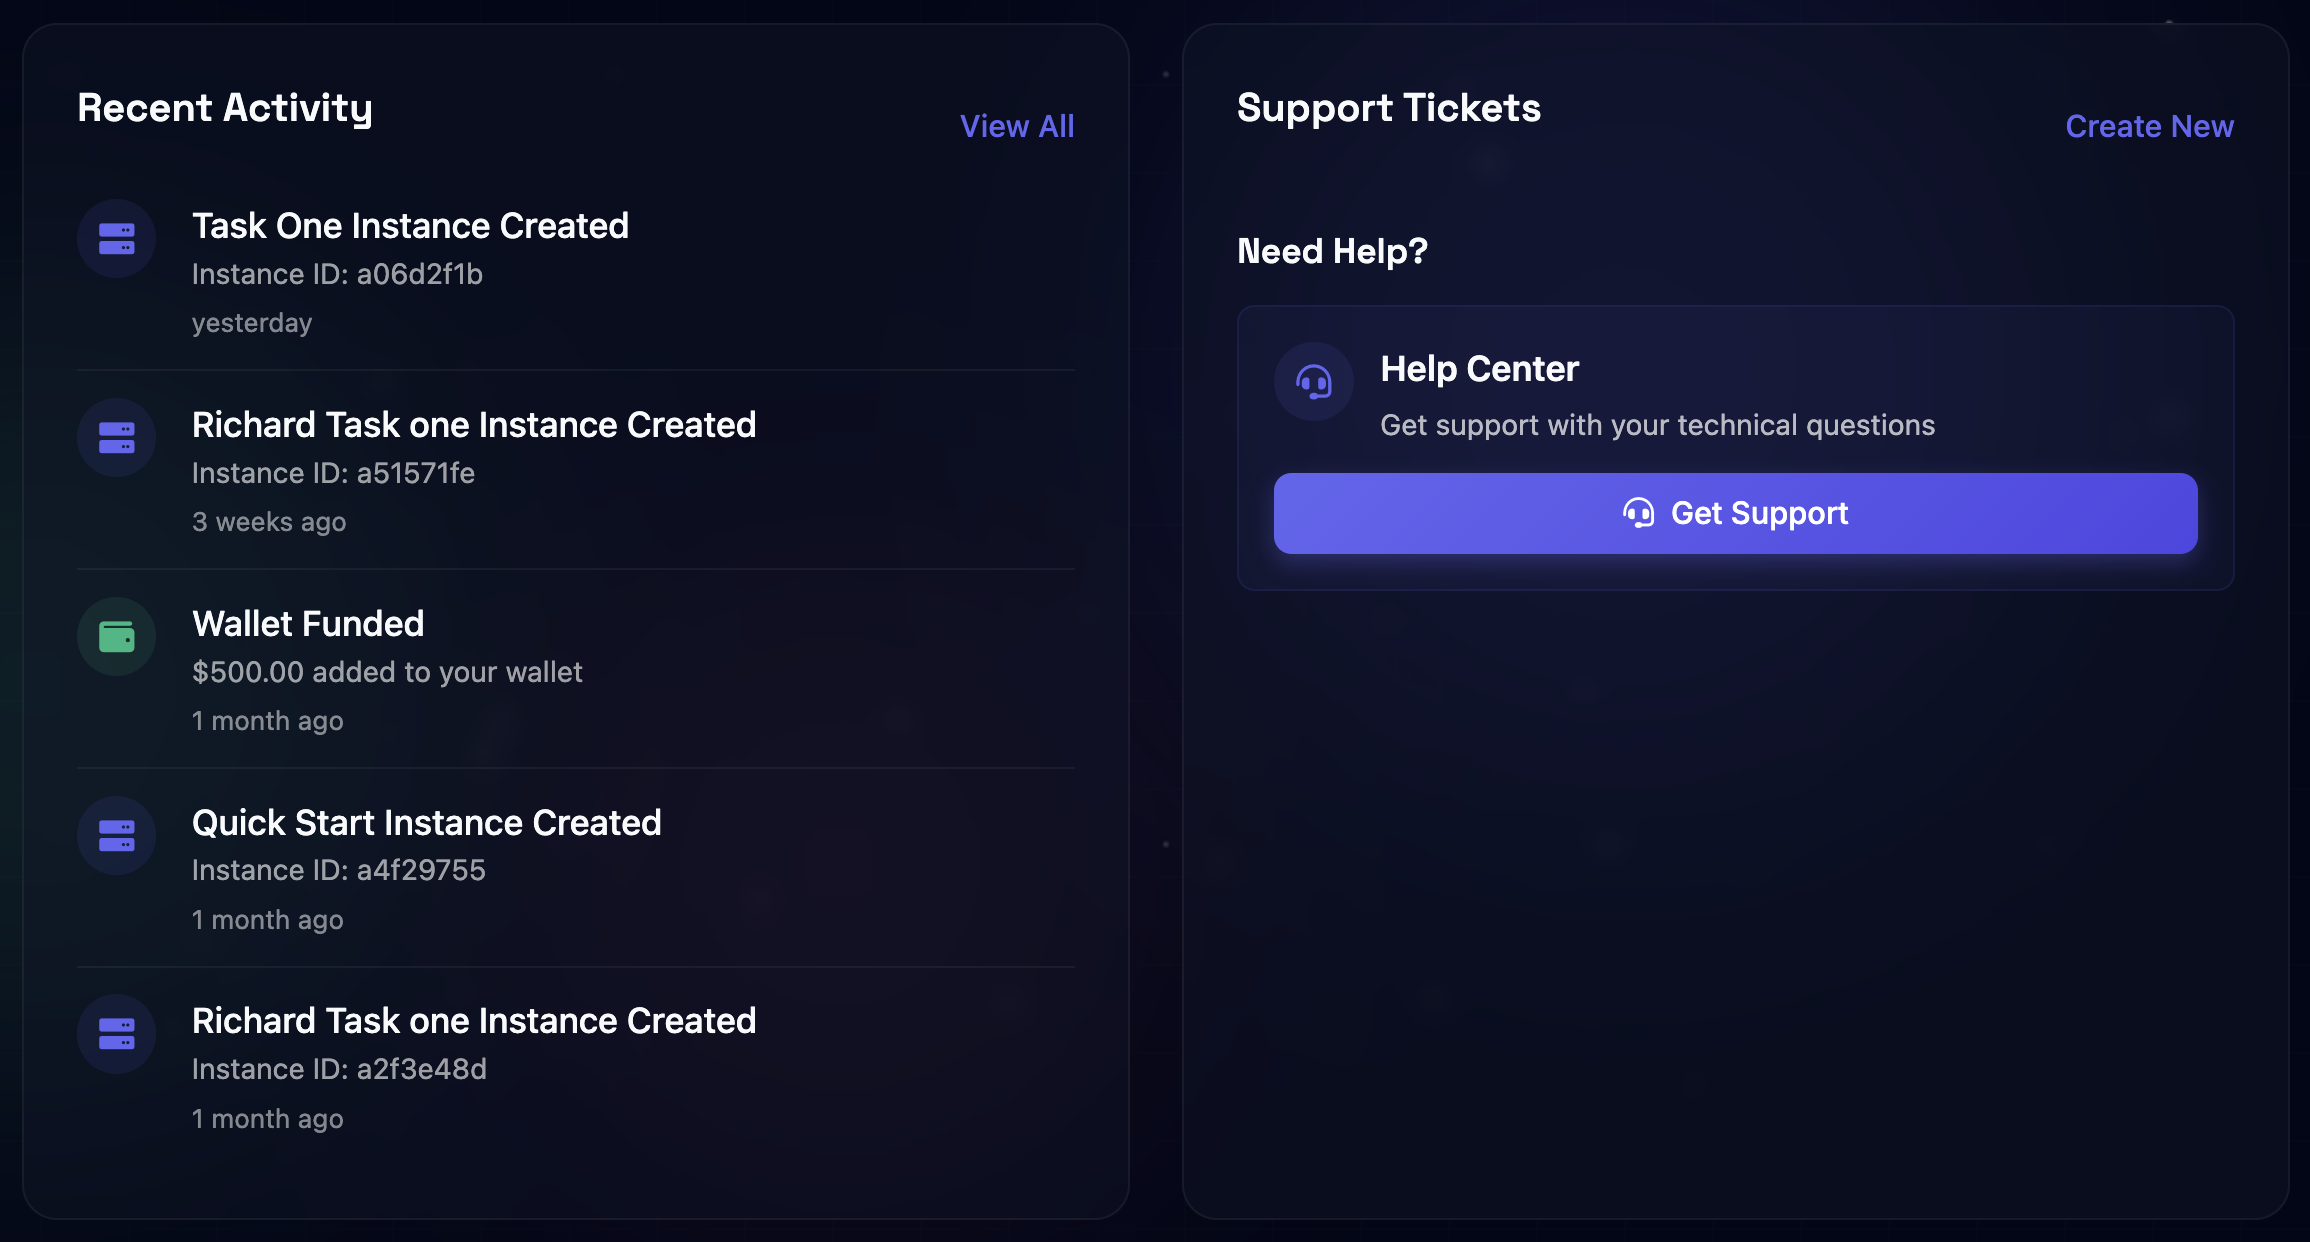
Fig 4. Activity & Support Hub with complete activity feed, timestamps, instance IDs, support tickets, and transaction history
Access a comprehensive activity feed showing all account actions, instance deployments, configuration changes, and system events. Each entry includes precise timestamps, unique instance IDs, and detailed action descriptions for complete transparency and audit capabilities.
Submit support tickets directly from the dashboard with automatic system information attachment. Access comprehensive help center resources, track ticket status in real-time, and receive priority support with dedicated account management for enterprise users.
View complete transaction history with detailed breakdowns by resource type, service usage, and billing periods. Export audit reports, track spending patterns, and maintain comprehensive financial records with full transparency and compliance-ready documentation.
SLYD's activity and support hub provides complete operational transparency with detailed activity feeds, comprehensive transaction histories, and integrated professional support. Access 24/7 technical assistance, maintain complete audit trails, and ensure compliance with enterprise-grade logging and documentation capabilities.
We're constantly improving our documentation and would love your feedback for our Beta release. Let us know how we can make it better!